Prada presents Diagrams, an exhibition conceived by AMO/OMA, the research and design studio founded by Rem Koolhaas. Organized with the support of Fondazione Prada, the exhibition will be on view at Prada Rong Zhai in Shanghai from March 14th to June 21st of this year.
The project debuted at Fondazione Prada in Venice between May and November 2025. It examines the role of diagrams in communicating data, emphasizing their capacity to generate meaning, foster understanding, and influence perception. The exhibition considers diagrams as pervasive analytical tools that shape how we interpret, organize, and transform the world around us. It also opens a broader reflection on the relationship between human cognition, scientific and cultural developments, and the production and circulation of knowledge.
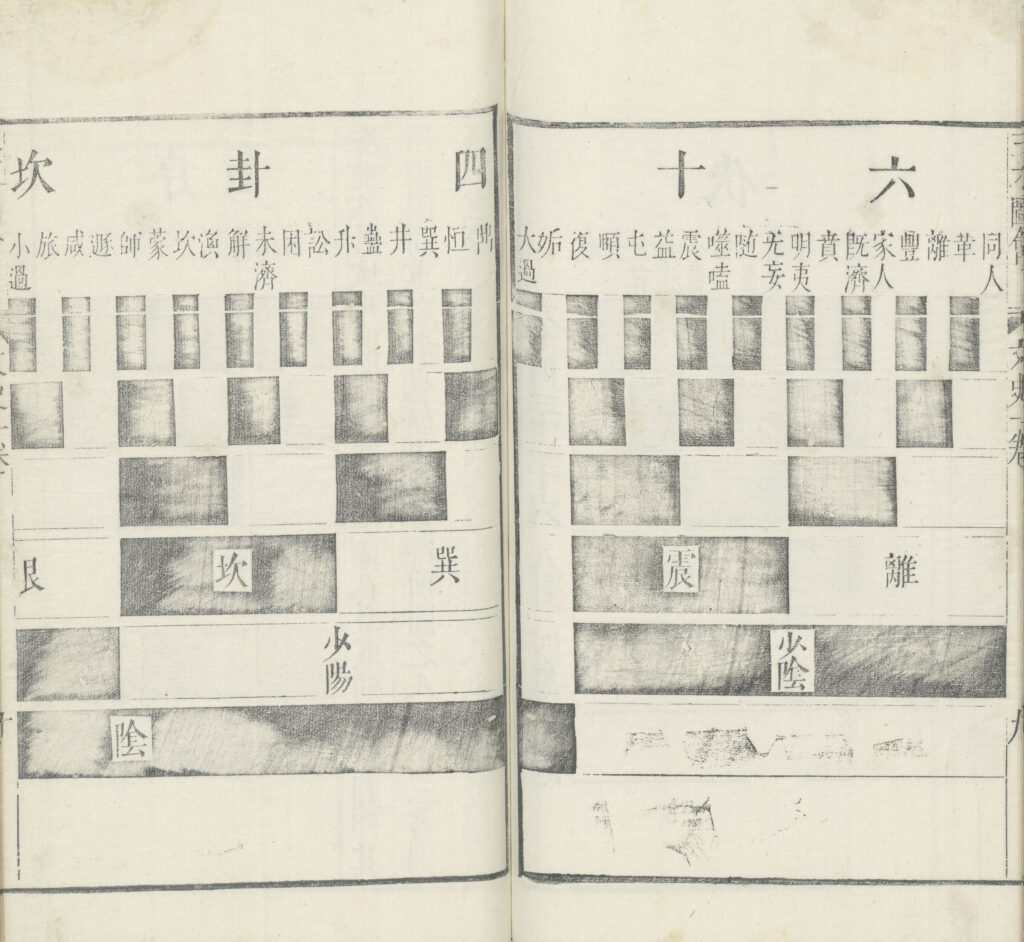
encyclopedia (1607-09) Ming period (XIV-XVII sec), 2025 Reprint | Courtesy National Library of China
The Great Horizontal Diagram embodies the dual logic that underpins Chinese thought and anticipates the binary code of modern mathematics.
This second iteration at Prada Rong Zhai brings together more than 150 works—including manuscripts, books, printed matter, digital imagery, and video—dating from the 12th century to the present and originating from diverse cultural and geographic contexts. The materials are organized thematically to address pressing contemporary concerns while demonstrating the diagram’s cross-disciplinary and transhistorical nature.
Rem Koolhaas describes the diagrams in function as a near-constant instrument in human history. During research for the exhibition, examples were identified ranging from three-dimensional diagrams created in South Africa around 40,000 BCE to carved wooden maps of Greenland’s coastline from Ammassalik. Such examples illustrate how diagrams persist across eras, adapting to new media and contexts. Whether explanatory or persuasive in function, diagrams transcend language and can be applied to virtually any sphere of human activity—from fashion and religion to social inequality—making them among the most effective forms of representation.
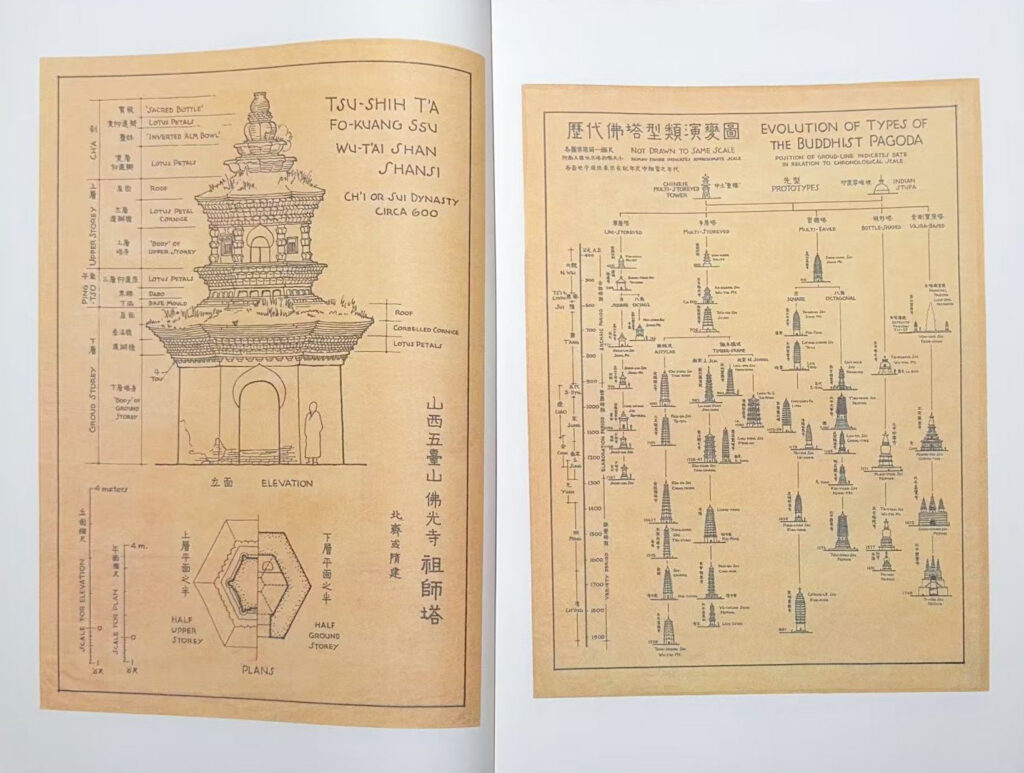
This volume presents a visual and analytical survey of traditional Chinese architecture written in English for a Western audience. It includes photographs, drawings, and diagrams of temples, pagodas, tombs, bridges, and imperial palaces, with detailed plans, elevations, sections, and evolutionary charts. It covers the origins of Chinese architecture and its two surviving handbooks from the 12th and 18th centuries; pre Buddhist architecture; cave temples; and wooden buildings traced through stylistic developments from c. 850 to 1911.
The exhibition unfolds across two floors of Prada Rong Zhai, occupying rooms that once served as spaces for domestic life, artistic work, and social gatherings. Structured around the idea of “present urgencies,” the exhibition is divided into five thematic sections: Built Environment, Body, Resources, Truth, and Value. Within each section, diagrams appear in multiple formats demonstrating how methods of visualizing information have evolved in response to shifting technologies, contexts, and audiences.
Across history, diagrams have played a central role in interpreting increasingly complex built environments. They have been used to survey territory, map movement, analyze social structures, and visualize urban growth. In the Built Environment section, works such as the Gansu Defense Diagram – China Wall (1507–1567) depict the fortified military network of the Ming Dynasty. OMA’s City of Exacerbated Difference (2001) examines the rapid and uneven urbanization of the Pearl River Delta, including Hong Kong, Shenzhen, and Guangzhou—an area Koolhaas described as a “City of Exacerbated Difference.”
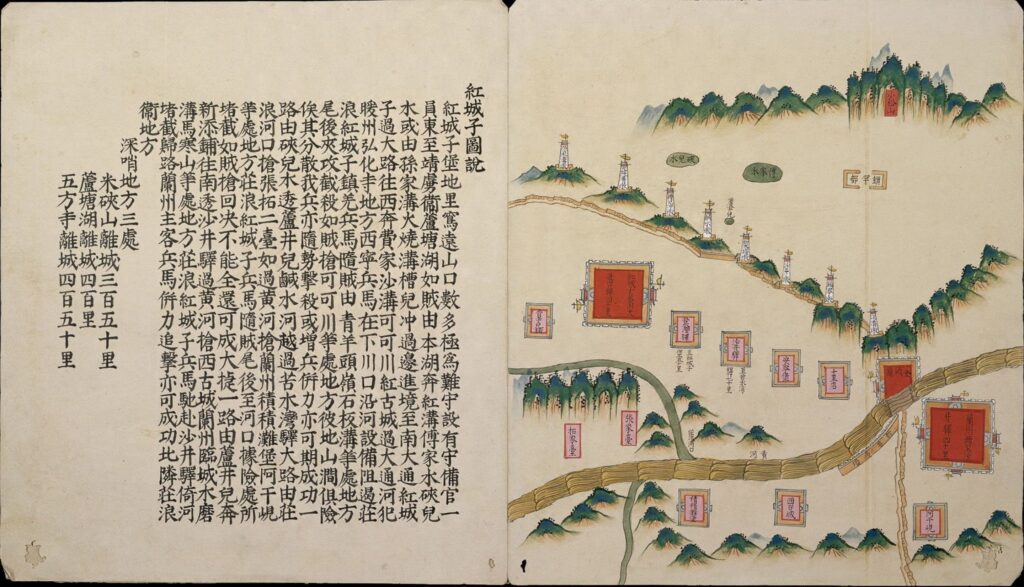
This map depicts the military defenses of the Gansu Garrison Command area during the Ming Dynasty from east to west.
Diagrams also function as tools for environmental analysis and architectural control, addressing energy use and climate conditions. With rising ecological concerns in recent decades, such visual studies have expanded into broader investigations of sustainability and resource management. The exhibition includes contemporary digital projects and videos from practices such as Arup, Atmos Lab, Transsolar, and Philippe Rahm, highlighting ongoing research into climate-responsive architecture.
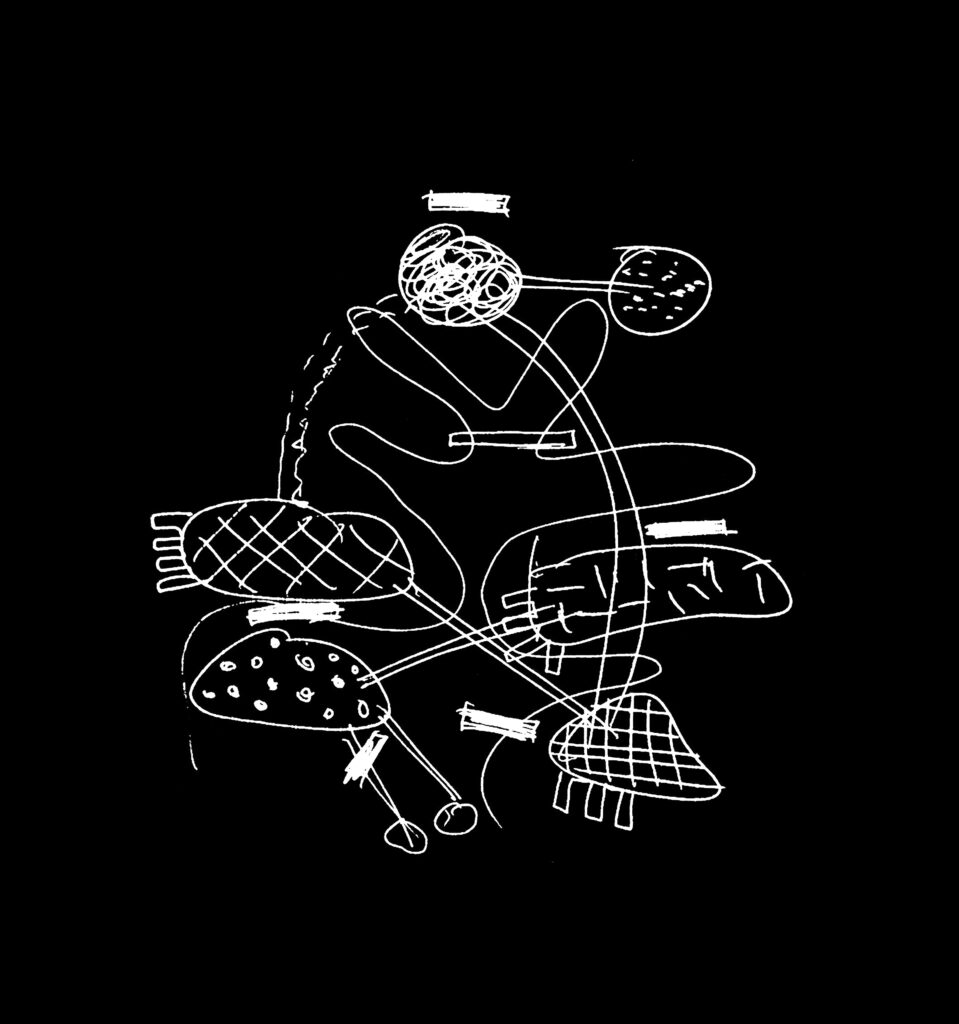
In addition, diagrams allow a diverse representation of the human figure—from precise medical and anatomical studies to spiritual and philosophical interpretations. Some depict the body as a mechanical system, while others frame it symbolically. Among them is the Neijing Tu (1886), a Taoist illustrated map portraying the body as an interior landscape, where the spine appears as a mountain and internal organs are rendered as symbolic figures.
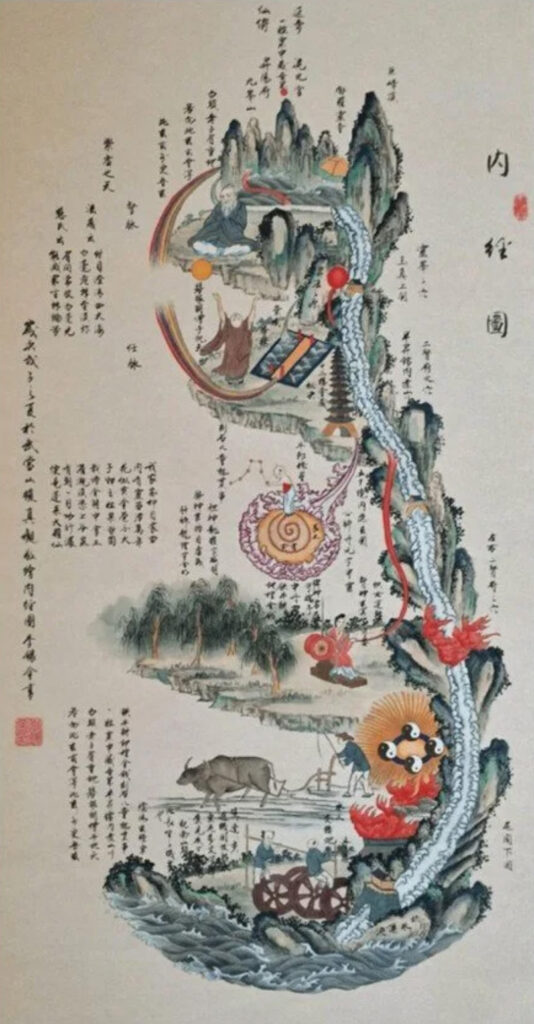
This Taoist “Map of the Interior Landscape” illustrates the human body as a microcosm, serving as a guide for internal alchemy (neidan) practices aimed at cultivating vital energy (qi) for longevity. In its anatomical symbolism, the spine is a mountain, organs are mythological figures (a weaver for the kidneys, a waterwheel for the base of the spine). The source of the coloured map is an engraved stele dating back to 1886, conserved in Beijing’s White Cloud Temple.
In fields such as astronomy, mathematics, religion, and historiography, visual schemas have long shaped knowledge by organizing information and revealing hidden relationships. The Truth section includes Yang Hui’s Triangle, first published in 1261 in Detailed Analysis of the Nine Chapters on the Mathematical Art, representing the earliest known depiction of what later became known as Pascal’s Triangle. It remains a landmark in mathematical visualization.
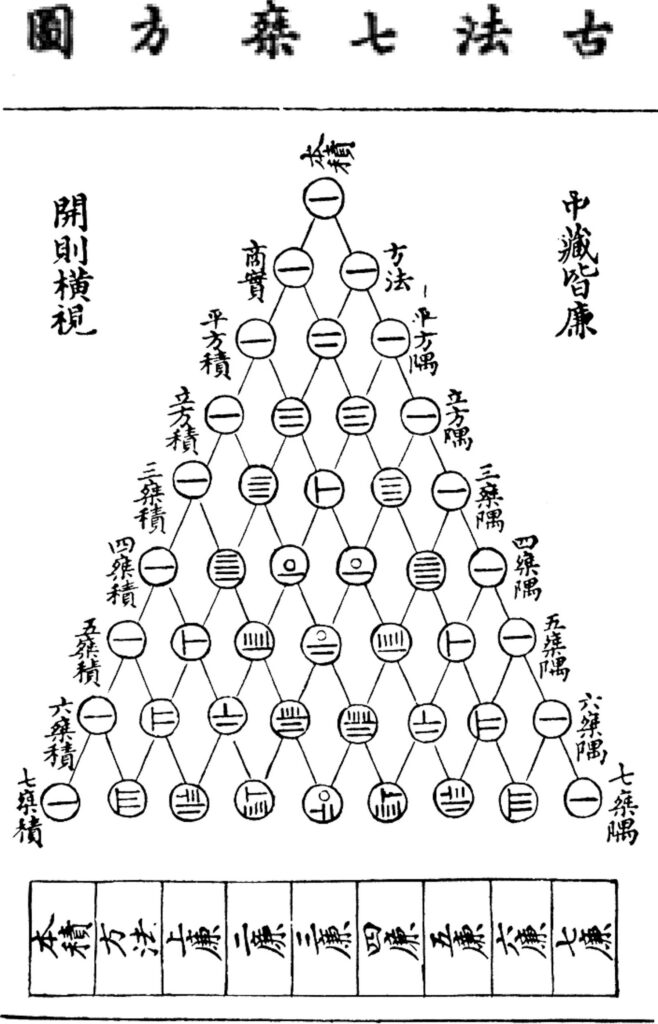
Yang Hui Triangle, also known as Pascal’s Triangle, is a triangular array of binomial coefficients. First published in China in Yang Hui’s Detailed Analysis of the Nine Chapters on the Mathematical Art (1261), it remains one of the most significant visualizations of mathematical principles in Chinese history
Ultimately, the exhibition frames the diagram as a device that appears objective yet actively participates in constructing meaning. By clarifying—or sometimes distorting—information, diagrams influence thought and behavior. In an era increasingly defined by data, revisiting the history of diagrams allows viewers to critically examine their origins, authorship, and intentions, and to reconsider the role these visual systems play in shaping contemporary understanding.
Discover More